Looking to save hours on report generation while delivering professional insights? Here’s a full walkthrough showing how to build a seamless automation that:
- Extracts GA4 data for two time periods
- Analyzes & compares it using Claude
- Generates a formatted executive report in Google Docs
You’ve seen this video demonstration—now let’s break it down into an actionable, detailed guide.
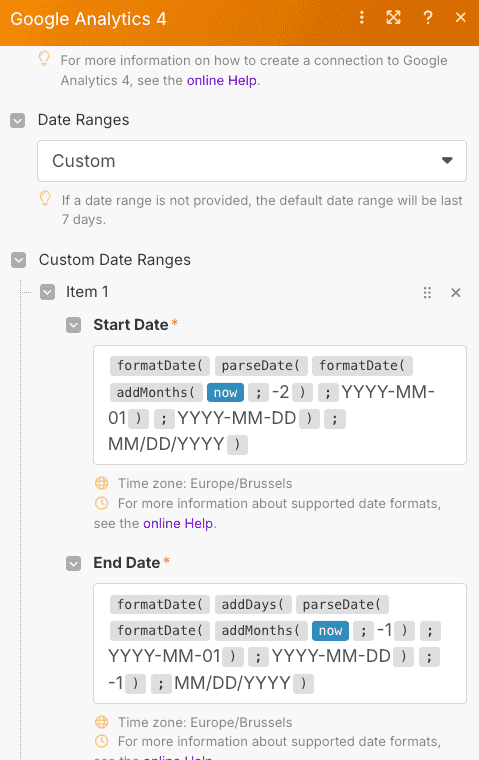
Step 1: Define Your Reporting Periods
- Decide your comparison windows (e.g., This month vs. last month; or this quarter vs. prior quarter).
- Adjust dimensions and metrics based on your goals (sessions, events, conversions, etc.).
Step 2: Set Up the Make.com Scenario
- Create a new scenario in Make.com.
- Add a GA4 “Get Report” module.
- Configure it to pull metrics (like sessions, event count) filtered by your chosen dimensions (e.g., sessionMedium, eventName).
- Apply filters to target specific events (e.g., eventName contains “macro”).
- Configure it to pull metrics (like sessions, event count) filtered by your chosen dimensions (e.g., sessionMedium, eventName).
- If needed, add a second GA4 module to fetch additional metrics not available in your primary module (e.g., sessions alongside events).
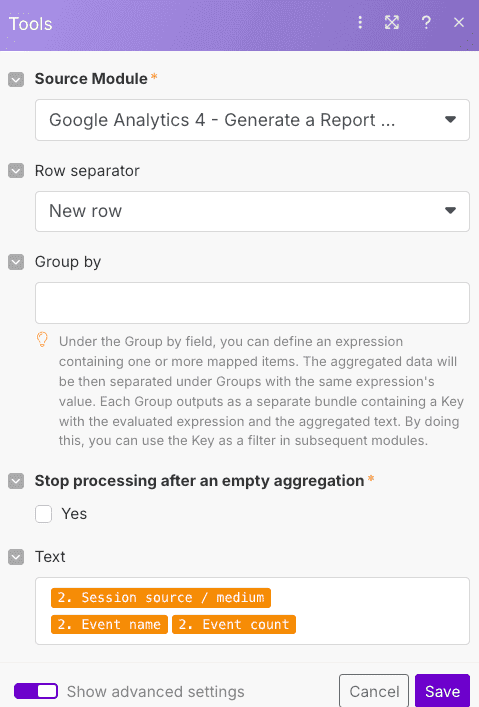
Step 3: Use a Text Aggregator
- Add a Text Aggregator module to consolidate raw GA4 outputs into a structured format.
- This makes it much easier to push the data into Claude in your desired layout.
Step 4: Integrate Claude for Analysis
- Add a Claude (or ChatGPT) module.
- Provide a clear prompt including:
- Your reporting goals
- An example of desired structure
- The two periods’ data
- Any special rules (e.g., “Treat today as current date”)
- Your reporting goals
This enables Claude to compare, highlight anomalies or trends, and draft narrative-level commentary.
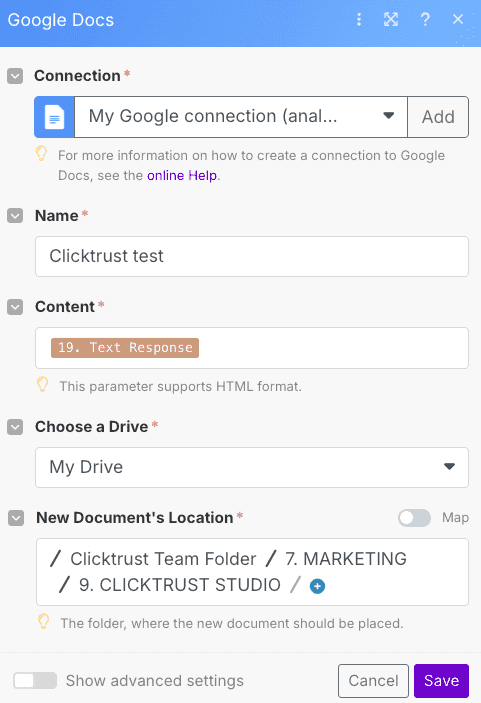
Step 5: Output to Google Docs
- Add a Google Docs module to receive Claude’s response.
- Specify a template or leave it open-ended—either way, the output is a ready-to-share executive summary.
Step 6: Run & Test
- Click Run on your scenario.
- Monitor the flow:
- GA4 modules return data
- Text aggregator compiles it
- Claude processes the comparison and writes insights
- Google Docs receives the final report
- GA4 modules return data
- Inspect outputs in each module to debug or tweak dimensions, prompts, or formatting.
But It’s Just One Way…
Want to explore other reporting automation strategies? We teach multiple approaches at ClickTrust — from dashboards and chat interfaces to end‑to‑end AI workflows.