As digital marketers, we frequently face the tedious and challenging task of compiling data from various digital platforms, cleaning it up, and creating meaningful dashboards. At ClickTrust, one tool we’ve found incredibly handy for this task is Funnel.io, which simplifies the process of cleaning, mapping, and combining data. Today, we’ll walk you through the step-by-step guide on how to use Funnel.io to streamline your data, campaign naming conventions, create custom metrics, and visualize your data easily through Looker Studio.
Step 1: Set Up Your Funnel.io Account and Connect Your Data Sources
The first step to using Funnel.io is to create an account and connect your marketing platforms.
– Go to Funnel.io and create your account.
– After logging in, navigate to “”Data Sources”” and click “”Add New Data Source.””
– Connect your sources (examples: Facebook Ads, Google Ads, Pinterest Ads, Shopify, Google Analytics, Google Sheets and more). Funnel.io supports a wide range of platforms.
Step 2: Cleaning and Mapping Campaign Data
Once your data connections are ready, the next step is cleaning and simplifying your data. A typical issue is having campaign names appear differently in each advertising platform.
Example of campaign naming conventions:
– Facebook Ads: “”Paid Social -2023-06 -ClientXYZ -SummerPromo-Shoes””
– Google Ads: “”Paid Search | XYZ Shoes | Summer””
– Pinterest Ads: “”Summer2023 – Shoes promo – XYZ brand””
Instead of manually cleaning this data in Looker Studio every time, you can quickly simplify the campaign names via Funnel.
Here’s how:
– Navigate to “”Dimensions”” under “”Data Mapping”” in your Funnel.io account.
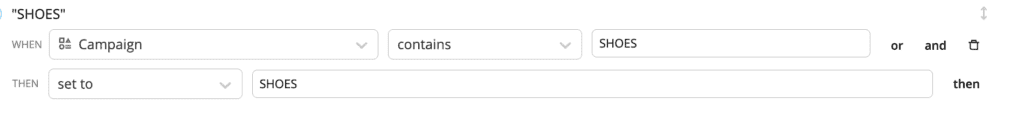
– Select “”New Custom Dimension”” and choose “”Formula.””
– Name your new dimension “”Product”” or “”Simplified Campaign Name.””
– Insert an easy ‘case when’ formula like the following:
Example formula:
Step 3: Create and Explore Custom Metrics Using Funnel.io
In addition to simplifying your campaign names, Funnel allows you to create custom metrics conveniently.
Example: Let’s say you want to use your Shopify backend data instead of the default purchase numbers shown by advertising platforms. You can use Funnel.io to create custom backend metrics like “”True Cost per Purchase.””
Here’s how you create your custom metric:
– Navigate to “”Metrics”” in Funnel.io and select “”New Custom Metric.””
– Choose the formula option.
– Define your custom metric clearly, for example “”Backend Cost per Purchase.””
– Enter a clear numeric formula such as:
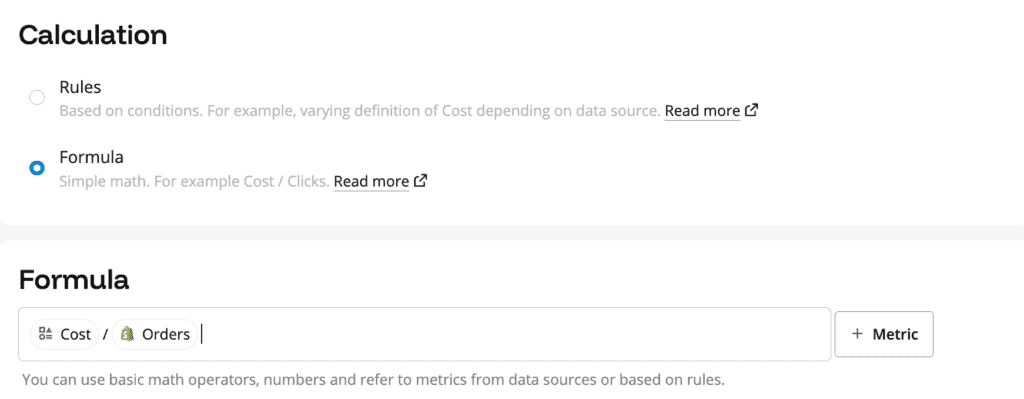
Note: Use Funnel’s built-in “”Cost (Custom)”” metric as it aggregates spend automatically from all platforms. Then select your Shopify sales data metric (“”Total Sales””) to get actual backend conversions.
– Select the unit type (“”Monetary””) and hit “”Create.””
The new metric is now ready to use and visualize.
Step 4: Mapping and Geographical Data using Google Sheets
If you have extensive campaign data about different countries or regions, Funnel allows you to map dimension data quickly.
This is how you do it:
– Create a new dimension like “”Country,”” choosing your Google Sheet as a lookup source.
– Define your dimension using a similar formula to:
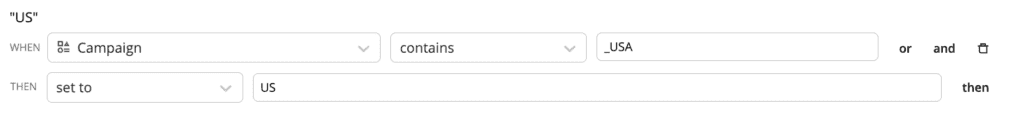
Funnel will match campaign names automatically to provide country labels that you can use in Looker Studio.
Step 5: Visualizing Data with Funnel.io & Looker Studio
Funnel effortlessly integrates with popular visualization platforms such as Looker Studio. Whenever you’re ready to visualize your data, follow these simple steps to integrate your Funnel data with Looker Studio:
– Click “”Export”” in Funnel.io and “”Create New Export.””
– Choose Looker Studio as your export platform.
– Select all dimensions and metrics you’ve prepared. Click “”Save & Export.””
– In Looker Studio, add “Funnel Data Source” as your data connection.
– Funnel-prepared dimensions and metrics will now swiftly appear as your available fields in Looker Studio.
Step 6: Testing & Maintaining Your Funnel Data Flows
After setting up your Funnel workflows, we recommend regular checks and adjustments to ensure accuracy:
– Verify your dimension mappings and metric formulas frequently.
– Regularly check your Looker Studio dashboards against original platform dashboards to identify synchronization errors or discrepancies quickly.
By effectively utilizing Funnel.io’s capabilities, you save hours spent manually merging data sources and creating custom dimensions and metrics. This efficiency allows you to spend more of your valuable time analyzing data, making better marketing decisions, and scaling your campaigns profitably.
If you need assistance with dashboarding or wish to learn advanced reporting and analytics strategies, feel free to contact us at Clicktrust and join our training sessions by visiting clicktrust.be.