
In one of our previous posts, we already explained what Google BigQuery is and why you should use it as a marketer. In this post, we will explain how you can create your very first BigQuery project with Google Analytics data.
1) Create a Google Cloud project
Google organizes your account with different projects. Each has its own scope, rights, and governance.
You’ll need to set up a project. It’s free if you stay on the free tier.
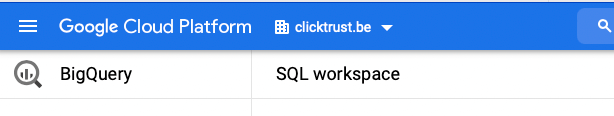
Step 1: Navigate to the Google BigQuery Platform
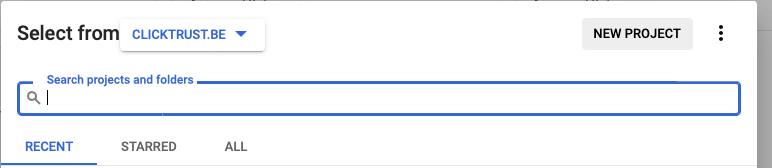
Step 2: Click on the drop-down menu and create a new project.
Step 3: Give your project a name, and an organization if relevant. Click on CREATE, you should see your project in the list.
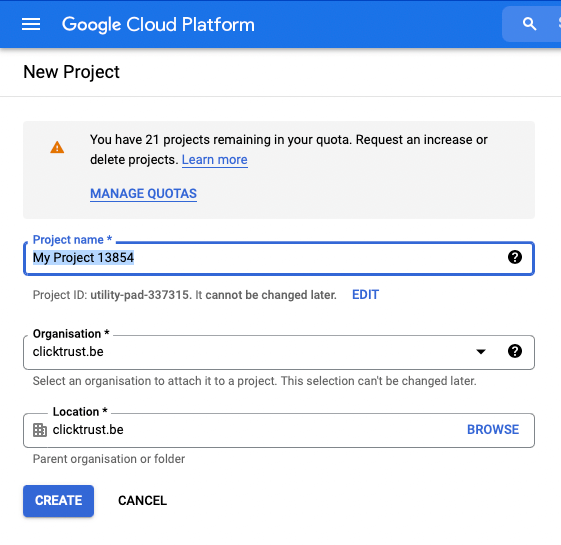
If you’re in an organization, check that you have proper rights, and your project fits in the organization’s governance. You may need additional rights to go further (for example, if you want to enable the billing).
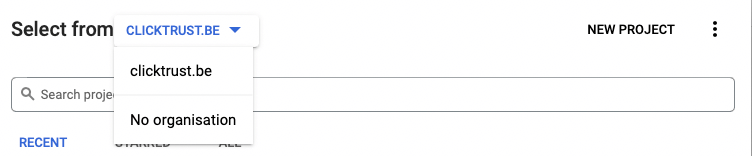
When you created the project, if you don’t see it in the list, and you didn’t set an organization, check on the drop-down list above: “No Organization”.
Step 4: Enable the BigQuery API on this project : on the left menu, click API & Services, then Library. Activate BigQuery.
2) Link GA4 with the BigQuery project
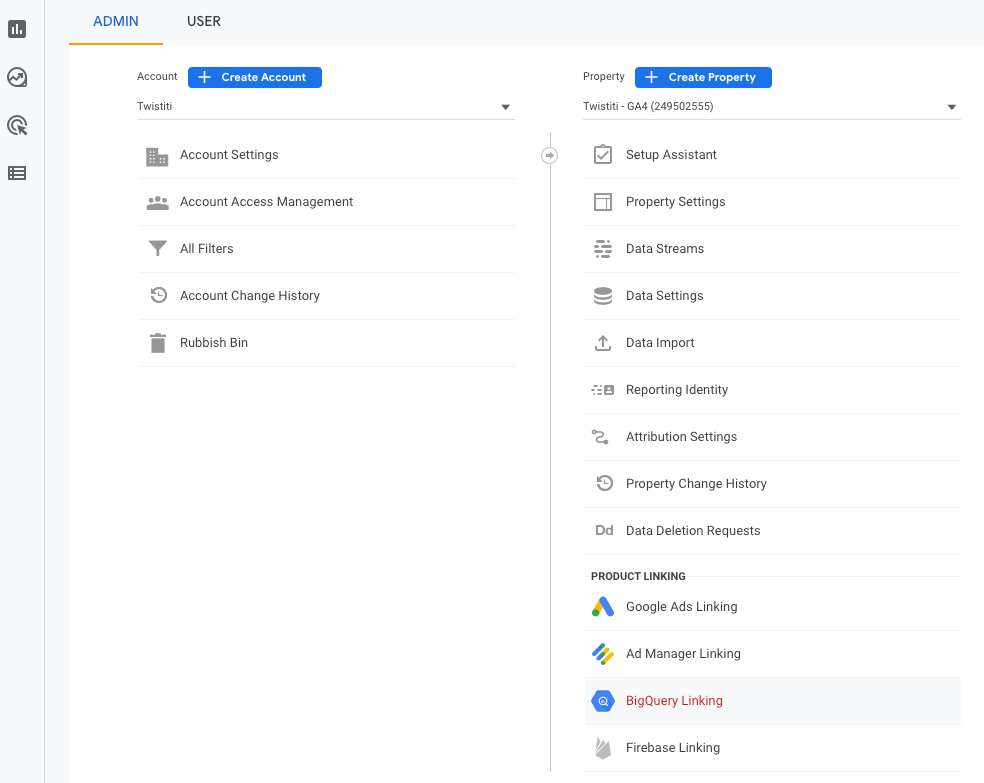
Step 5: Go to your analytics account (https://www.google.com/analytics) and click on Admin. Then Big Query Linking under “product linking”
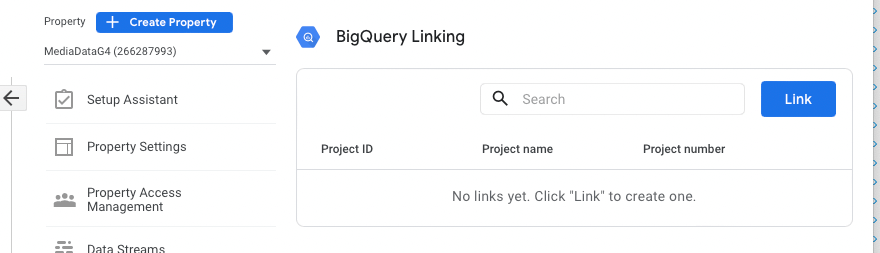
Step 6: Then click on Link. You’ll see Google projects you have access to. It’s possible to link with a Google project you don’t own. But you’ll need admin rights on the Google Analytics properties and editing on the google project.
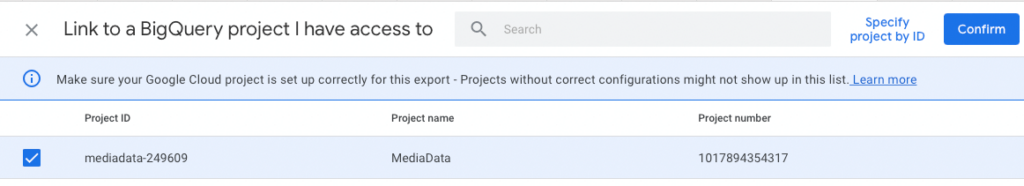
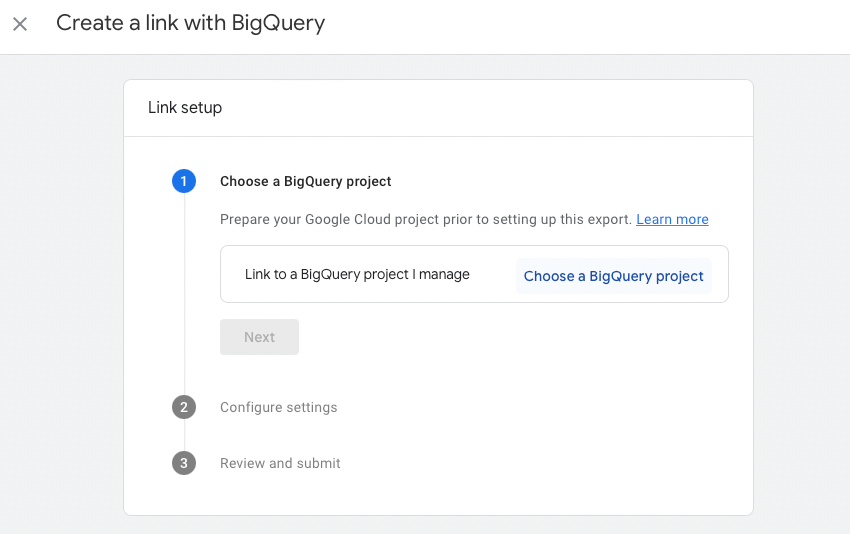
Step 7: Then, on Choose a Big Query project and click on Confirm
For longer explanations, check the documentation.
If you go to the settings of the link, there are two options of updates: Daily (each night) or streaming (continuously). You’ll need to enable billing for streaming.
3) Add the User ID (optional) in the Google Analytics Setup.
To do multidevice analysis on GA4/BQ, you’ll need a user ID, that is valid across all devices. That’s not the case of Google Analytics (id), called user_pseudo_id, which lies in the GA cookie.
If you pass a UserID to GA4, it will be present in the BigQuery under the field “User ID” and therefore enable multi-device/session analytics, without being dependent on cookies.
There are several ways to do it. It will depend on the implementation of your Google Analytics on your website. The simplest is to call add a code snippet on your site, after the gtag function
            gtag('config', '**YOUR GA property ID**, { 'user_id': 'User_ID'

       , 'ad_storage': 'denied' });
Be careful: from now on, you track the behavior of your consumers with a personal identifier. Therefore, you are a processor of personal data and must fill your legal duties like getting consent. Act with caution: it is considered as server-to-server tracking, so may be out of your cookie policy. You can set limits to the usage of this user_id, by example setting the parameter “ad_storage : ‘denied’).
4) Play with data on the UI
Go to the Big Query platform
You’ll see on the left the projects: expand and click on events_ (intraday) if you chose streaming)
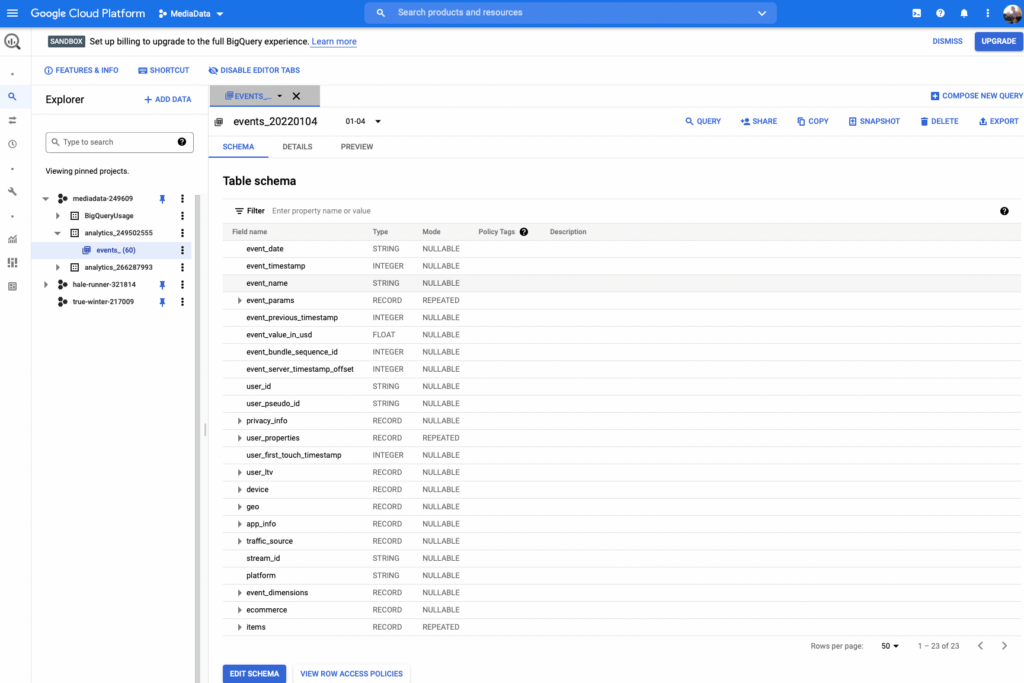
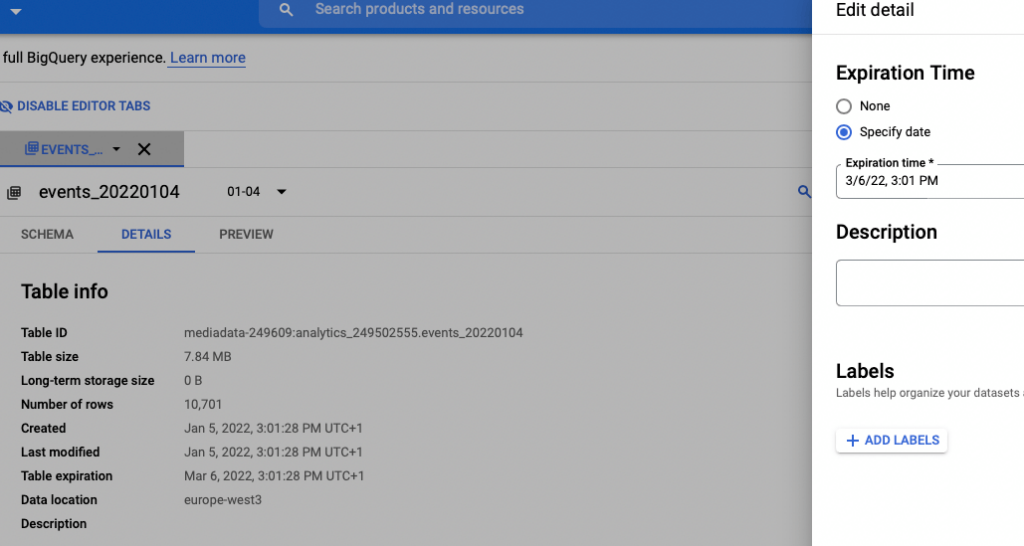
Tip: a day of data is valid for only 60 days. You can expand by going in the DETAILS tab, then EDIT and specify a new expiration date. You’ll need to make it for each day, one by one, though.
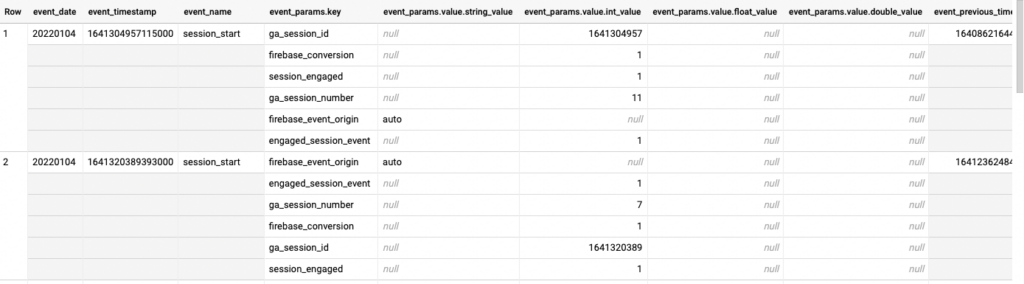
You can preview the data on the tab Preview. If you’re used to MS SQL, you’ll see something new: nested tables. It’s like a table in a cell.
If you add the CRM id in the customer data ID of Google (User ID in Big query), you’re able to merge the online behavior of your customers with their sales and offline behavior.
If you click on Query, you can write your first query
SELECT * FROM `mediadata-249609.analytics_249502555.events_20220104` LIMIT 1000
In the upper right corner, you’ll see how much data the query will process.

(you won’t be charged for the first TB per month).
You can read all the days by setting an asterisk on the table name :
SELECT * FROM `mediadata-249609.analytics_249502555.events_*` LIMIT 1000
Beware of data consumption! Try your queries on a specific day, then expand it on the whole data set when you’re sure.
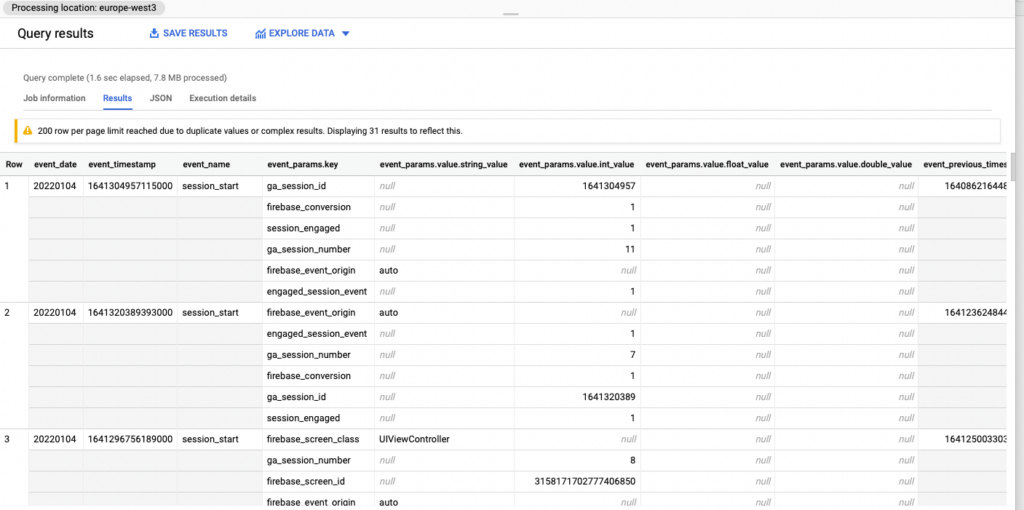
If you click on run, you should see your data
You can also visualize your data in DataStudio.
You may review your SQL to use this platform. Useful tips to consider :
- Dates: you can parse date with the parse_date function. If you type the following code in your Select code, you’ll have a nice YYYY-MM-DD formatted date
parse_date('%Y%m%d',event_date) as event_date,
- Nested data : You see that a single cell can hold an entire table. Event_params is a table, in a single record. To “unnest” the nested table, you must use unnest function in a nested SQL query.
Select
(select key from unnest(event_params) where key = 'page_location') as event_key,
(select value.string_value from unnest(event_params) where key = 'page_location') as event_string_value,
From `mediadata-249609.analytics_249502555.events_20220104`
You’ll have a good old two-dimensional table:
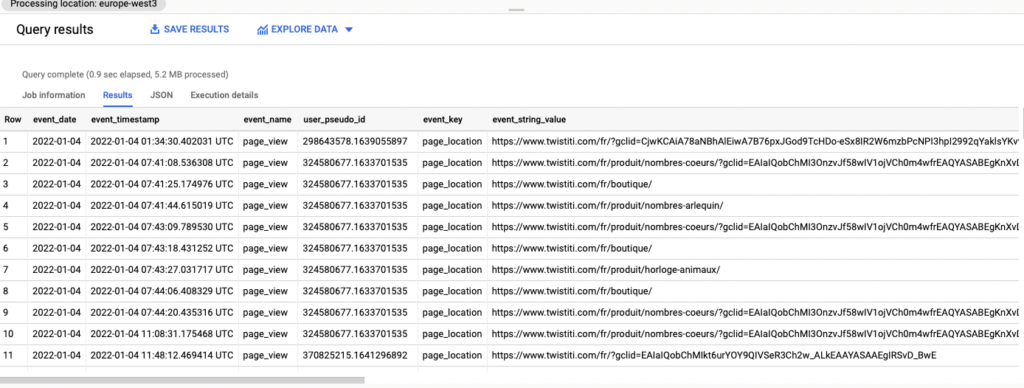
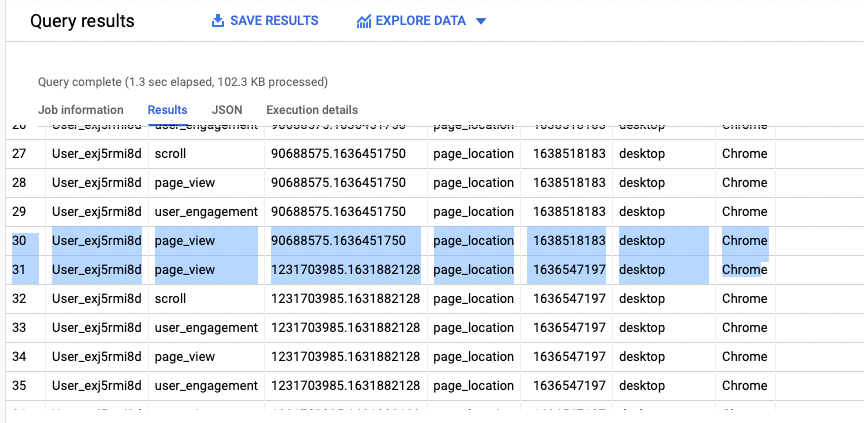
Good news: the user_id mentioned in point 3 is there, and it has different ga_session_id’s. So it’s possible to analyze its behavior cross-session and device.
5) Connect with R
Using the UI of BigQuery is nice, but besides using Data Studio connectors, you can’t visualize or process data without paying BigQuery processing fees.
Odds are you want to analyze that data with a language that allows you to create machine learning algorithms . Python, like other programming languages, is well documented.
I personally use the bigrquery package (https://github.com/r-dbi/bigrquery) , which works well with that code :
library(bigrquery)

bq_conn <-  dbConnect(bigquery(),

                       project = "project ID",

                       dataset = " name of dataset",

                       use_legacy_sql = FALSE
)

SQLSTR <- “Select * FROM table”

  billing <- "project ID"  # replace this with your GCP project ID

  tb <- bq_project_query(billing, SQLSTR)

  df <- bq_table_download(tb)

print(df)
Recevez notre newsletter &
nos insights
Nous approfondissons les sujets brûlants du marketing numérique et aimons partager.