
The Cohort report is one of the most overlooked features in Google Analytics, yet, it’s one of the most powerful.
Have you ever wondered how many times a user comes back to your website? How many visits did it take a user to convert? What the Lifetime revenue of a user is? Cohort reports can help you with these questions.
What is a cohort report?
The term cohort refers to users grouped by a shared attribute. For now, on Google Analytics, the only attribute available is the acquisition date: the first time the user visited your website or app or did the first purchase.
Based on this shared attribute and the timeline, the cohort report shows you the repeated behavior of each group over time. It helps you to understand the behavior of your users, and identify trends, patterns, and retention behavior. It will also help you measure your campaigns’ efficiency over time.
In the cohort report, you can use 3 types of metrics :
- Retention: the number of users who returned, and how many times they returned in a period
- Metrics per user: these reports show the averages for the cohorts. It gives a view of how much the average user in a cohort is spending, converting or coming back to the website.
- Total metrics: It’s a sum of your different metrics (revenue, sessions, number of users, metrics, etc…) by period (day, week, month). With this report, you can identify peaks in returning users’ behavior. This report can be useful to identify the impact of newsletters or retargeting campaigns for existing customers
How to use cohort reports?
To use the cohort report with unified data, you need a user ID-enabled property. Otherwise, the cohort report will only be based on cookies, with the limitations we know, and won’t be accurate. However, if there is no login feature on your website, you can pull basic retention data such as repeated behaviors with in mind that the data might not be 100% accurate.
Once a user creates an account, they receive a unique user ID in the CRM. This user ID has to be pushed back into the data, allowing you to reunify their sessions and engagement in time and cross-device.
In Universal Analytics, you need to create a new user ID view. In this user ID view, the data (visits, interactions, order …) of known user IDs will be unified. This means that this view will only contain sessions that can be linked to users with a user ID, so, compared to a regular view, the available data is much lower. Be careful, if you’re trying to use the cohort report in the regular view, your insights will be faulty. Users are identified with cookies, and there might be deduplication between devices and sessions.
However, in GA4, there is no need for a separate view. If you implement the User ID, you can use it in your report as a dimension to create a retention report.
How to read cohort reports?
See below the cohort report of an e-commerce client that has a lot of repeat purchase behavior. If we were only considering the purchases made on the acquisition date, we would miss the actual value of a client over time.
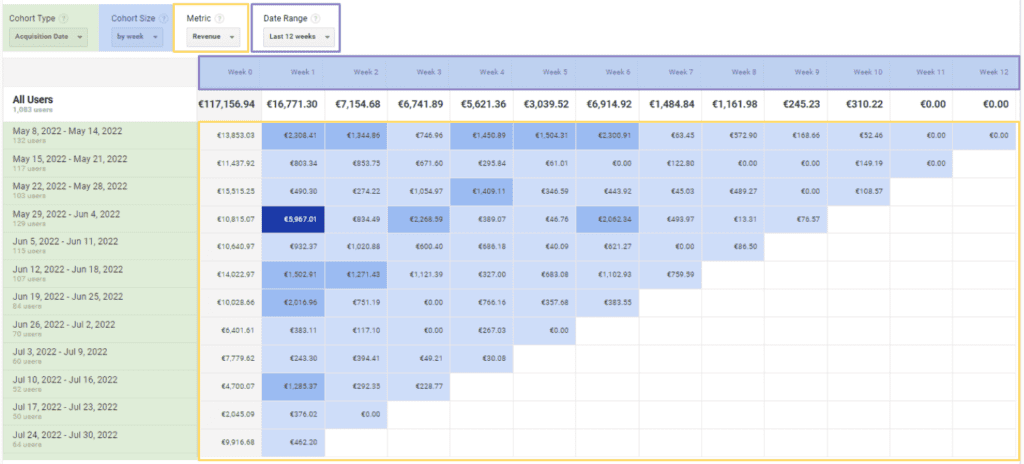
If we looked at the revenue of weeks 08/05 to 14/05, the value of this cohort would only be €13.8K. But looking at this cohort for 12 weeks shows us their actual value was €24.3k (the sum of all the weeks added for this cohort).
It raises the following strategic questions :
- What is the value of a client over time?
- How much can we afford to acquire a new client?
- Did we do campaigns that succeeded in bringing in more loyal clients?
- If we stop doing retargeting or retention campaigns, do we see a change in the cohorts?
- If a cohort is underperforming, are there ways to re-activate it?
- Is it worth it to create retention-only campaigns?
Something to be wary of is that the cohort report in Google Analytics has a 12-week/3-month limit. To keep historical data on the behavior of your cohort, you could consider exporting the data to a spreadsheet, but this is a very bothersome task. The ideal solution is to just build this report from your CRM Data. There are no limitations to using this method.
To finish, if you’re considering your relationship with your client in the long term, why would you look at their performance with short-sighted KPIs? A cohort report takes your strategy to the next level. Ignoring the lifetime value of your client is a blind spot in your strategy. With the cohort insight report, you add another layer of understanding of your customer base and can split your marketing budget between CAC vs. CLV. Without having a view on these metrics, you risk underinvesting in acquisition or losing existing clients to competition. It’s about balance, and the cohort report can help you reach it.
Get our ramblings right in your inbox
We deepdive into hot topics across digital marketing and love to share.