
In today’s competitive business landscape, understanding and leveraging customer lifetime value (CLV) is crucial for sustained growth and profitability.
CLV refers to the predicted business value a customer will generate throughout their relationship with a business. In businesses with repeat purchase behavior, CLV plays a vital role in determining marketing strategies, customer retention efforts, and overall business success.
This article will explain how you can adapt digital marketing campaigns for future revenue with the use of Customer Lifetime Value.
Repeat purchase behavior
At CLICKTRUST, we have several types of clients that are active in different industries. One segment is e-commerce. In this vertical, we have 2 clients that are similar in terms of client behavior as they both have clients that are coming back to the website to buy again. The difference between both is that one sector is extremely competitive with low margins, which requires a slightly different way of looking at the data.
In both cases, we need to have an idea of the future revenue of recently acquired clients to be able to assess the proper investment level and channel mix today.
Also, read our 10 tips for managing campaigns for businesses with recurring purchasers.
The metrics
Customer Lifetime Value
To be able to make an assessment of the expected revenue of new clients, we need insights in the customer lifetime value. For customer lifetime value, we use the following formula:
Customer lifetime value = ((Average order value x purchase frequency)/churn rate) x profit margin
Average order value = Total revenue / Total transactions
Purchase Frequency = Total transactions / (New clients + Returning clients)
Repeat (customer) rate = Returning clients / Total clients
Churn Rate = 1 – Repeat (customer) rate
All of this information needs to come from a stable data source that is ideally not cookie-dependent, like a CRM or the backend data of a website. Read more on the death of cookies and how to activate CRM data.
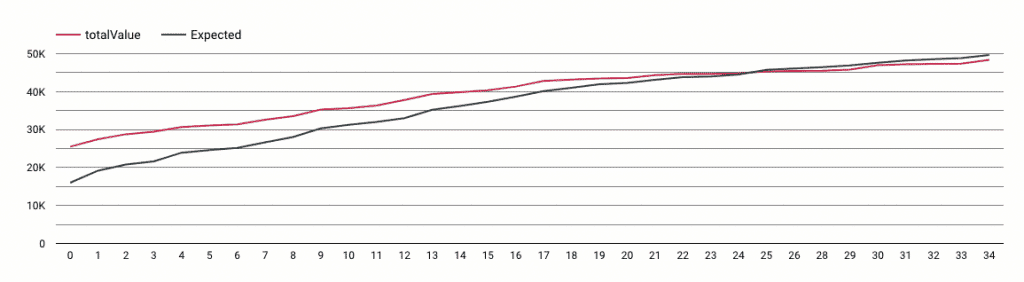
With the insights of the customer lifetime value, we can start to make predictions for the future revenue. The customer lifetime value multiplied by the number of new clients can be used as the expected future revenue. Based on the real incoming revenue and the expected revenue, we can monitor the client behavior and adapt marketing efforts accordingly (more details on this later).
Customer Acquisition Cost
Aside from the Customer Lifetime Value, we also need to take into account the Customer Acquisition Cost. This is especially important in low-profit margin sectors. We don’t want to give up all our long-term profit to acquire new customers, and we also don’t want to keep paying a retention cost that is equal to our margin.
For Customer Acquisition Cost, we use the following formula:
Customer Acquisition Cost = Total Cost / New Clients
In this metric, we can incorporate different types of costs that are not necessarily related to marketing:
- Media cost (spend in Google, Bing, Criteo, Facebook, Programmatic, …)
- Management fee of agency
- Payment service provider fees, if any (Ogone, Adyen, PayPal, …)
- Hosting of the website
- Salaries of (marketing) staff
- ….
The more business costs that are included in CAC, the better the business insights will be in the dashboard that we create with this.
CLTV/CAC
Once we know what revenue we can expect in the future and what the cost is to acquire a new customer, we need to go look for a balance between both metrics.
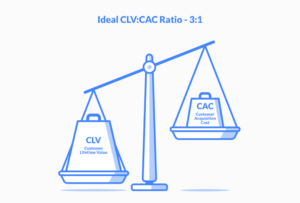
This balance can be monitored by looking at the ratio CLTV divided by CAC. We often see a ratio of 3 is what you need to aim for, but the right balance between CLTV and CAC depends on the business goals.
If we put this ratio at 1 it means that the cost to acquire the client and the revenue that customer will bring you is the same, so you are not making any profit.
If the CLTV/CAC ratio is high, that means that you are acquiring very profitable clients at a very low cost, but those clients will also likely be high value for your competitors. A very high CLTV/CAC ratio means we have room to be more aggressive or room to invest into more upper funnel channels to increase brand awareness.
Cohorts
Google Analytics Limitations
For this important note on the limitations of the cohort report in Google Analytics, you can read more in our article on cohort analysis in Google Analytics.
Going beyond the limitations
We have gone beyond the limitations of what is possible in Google Analytics for one of our clients. We are recreating the cohort report based on the client’s business data, allowing us to follow our clients for a longer period of time. With this, we could see that for some of our products, people stay loyal for over one year (+72 weeks since first purchase).
Making it visual
To make it easier to digest and to make decisions easier we have built a dashboard with a split by country and by product category as we know from historical data that the behavior of clients is different depending on category and country.
The dashboards are helping us and our client to sleep at night when we are investing the budget right now for future revenue. These dashboards allow us to prioritize the budgets to where the most valuable clients are and where we can acquire clients at the cheapest cost. Secondly, we can also assess if we are over or underinvesting in specific product categories.
Aside from that, we can also follow the different cohorts to see if they keep on behaving as expected. If not, we need to adapt something to the campaigns.
Looking at the data in this way also avoids issues with attribution. We are looking purely at the cross channel performances in these dashboards. With this view, we also allow investments in upper funnel channels that will not generate directly attributed sales. As long as the ratio CLTV/CAC is within the business target, we can keep these investments.
Adapting campaigns
As mentioned before, based on the ratio CLTV/CAC, we can adapt the campaigns. This ratio has 2 components that can both be used to optimize the ratio.
In case the CLTV/CAC is higher than the target, this means we are underinvesting. This scenario gives us the opportunity to test more upper funnel channels that generate awareness. If the ratio stays high, it means we are acquiring high value customers at a very low cost, but we are also missing opportunities.
In case the CLTV/CAC ratio is too low, we have 2 options again. We lower the CAC or we increase the CLTV. To lower the CAC, we can do several things. The obvious one is lowering the bidding in the Search campaigns, but in a very competitive market that will lead to a decrease in the traffic and conversions. This is why we suggested investing into SEO. This has a long term effect and the CAC of organic search is low. On the other hand, we also have the option to increase the CLTV. This can be done through follow-up emails, promo codes, loyalty programs, etc.
We also have to take a look at the different cohorts that were generated. Are they still behaving as expected? In case they are – great -, we don’t have to adapt anything for these customers.
If they are not, it’s time for us to interfere and make the cohort “jump”. On the following graph, there is an example of a cohort that jumped:
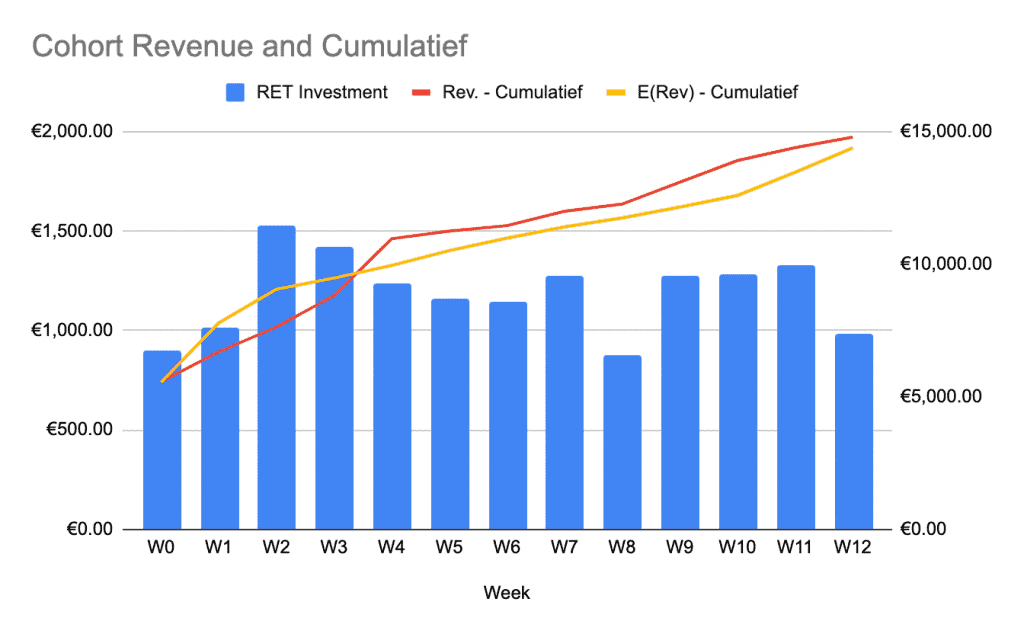
As you can see, the red line (real revenue) was below the yellow line (expected revenue) in the first weeks of the client relation. We can also see that during these weeks we have a higher investment into the retention campaigns which are targeting those clients. In Week 4 we see a sudden increase of the cohort revenue and afterwards the cohort revenue is behaving as expected. Even when we lowered the investment in retention in W5 and W6 we still managed to keep the red line above the yellow line. The fact that the cohort revenue slightly decreased (coming closer to the expected revenue) shows that we can use this lever to guide the cohort revenue towards the expected revenue.
In another cohort we see that the cohort revenue (red line) is always above the yellow line (expected revenue).
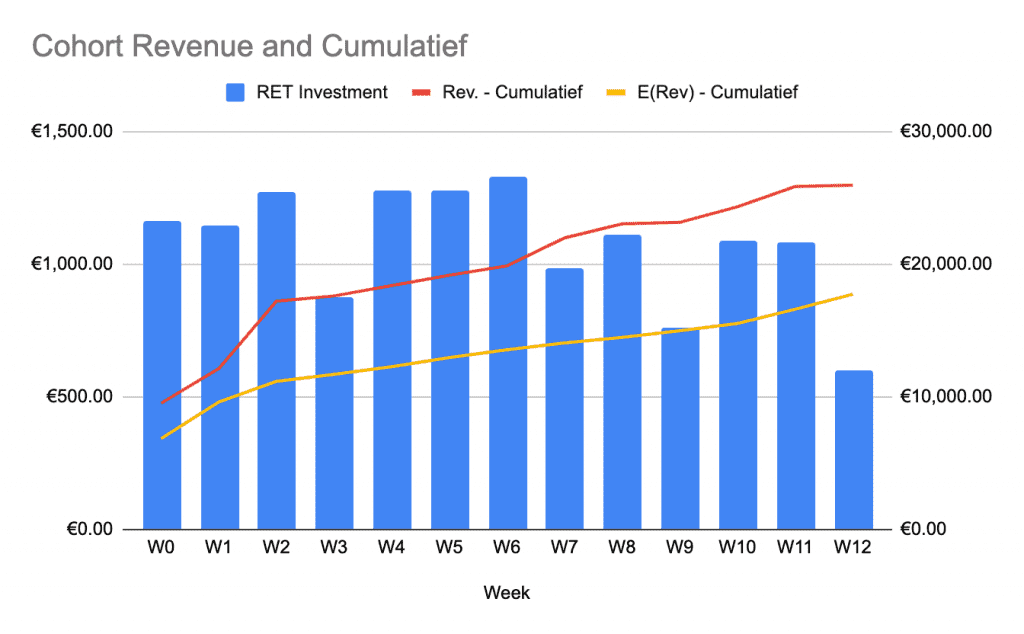
Here we are actually overinvesting in retention, as that cohort is already behaving as expected. We didn’t have to invest that much of the budget in retention and should move that budget to Acquisition of new clients.
This is how we at CLICKTRUST look at optimizing marketing for businesses with repeat purchase behavior. It’s scary to invest so much marketing budgets upfront without having a view on the revenue it will generate in the future, but it’s the key to run proper marketing for repeat purchases. If you keep on looking at the short term returns, your business will stop acquiring new clients and stop growing.
Roadmap for implementation
1) Getting a view on the Customer Lifetime Value (CLTV) is the most important but also complicated step. To get the most accurate view you’ll also need to have this based on business data and not based on digital analytics as this has issues with cookies
2) The creation of a dashboard allowing real-time monitoring of the key metrics will enable correct decision-making and also buy-in from management as they see the data coming in
3) Adapting the campaigns by using the insights from the dashboard. We suggest testing the approach on part of the business first (one product, one product category or one region/country) before rolling out across all campaigns
4) Continuous monitoring of the CAC/CLTV ratio for optimization.
5) Evangelization internally to look at the CAC/CLTV, arguing that this is the metric that looks at future revenue. This is better than focusing on very short-term direct revenue numbers causing us to pay an acquisition cost for an existing customer every single time they purchase.
Recevez notre newsletter &
nos insights
Nous approfondissons les sujets brûlants du marketing numérique et aimons partager.