
What a pleasure to be able to go back to a conference after 2 years of being stuck behind a computer!
It is so much better to be able to assist in presentations, meet speakers, and discover tools in real life and the Brighton SEO conference did not disappoint! In this article you will find the main takeaways from 3 of the most interesting talks I joined, I hope you will find them useful as well!
1) The full scoop on Google’s title rewrites
As you have probably already heard or read, Google has been rewriting title tags since August 2021.
Why is this happening? What is Google pushing for the rewrite? Those are questions that a few SEO experts have been asking themselves.
Google is rewriting title tags and it is happening more frequently! Back in October 2021, Google was rewriting 62% of title tags compared to 65% in January 2022. In this talk, Mordy Oberstein shared some insights regarding his own analysis. He had a look at different variables to try to figure out in which cases Google is rewriting meta titles!
Device?
There is no noticeable difference here. Indeed, Mordy saw that on both desktop and mobile devices, Google is rewriting our title tags.
Position?
Mordy also tried to understand if the position is impacting Google’s choice to rewrite the title and the answer is no. Whether you’re showing in the top 5 or top 20 makes no difference.
Title length?
He also analyzed the title length, to see if Google would tend to rewrite title tags based on their length, but here again, the answer is no. Both short (1-7 words) and longer (12+ words) title tags are being rewritten by Google.
Search intent?
Another possibility could be search intent. Google would be rewriting the meta title to make it match the query and the searcher’s intent. Here again, his answer is no.
The conclusion so far is that neither position nor devices or length is impacting Google’s decision for the rewrite. We’ve been trying to find a logical explanation here but there isn’t, said Mordy. Google is doing it because it wants to do it and because it can, well, typical Google..you know!
To him, the conclusion is that Google’s algorithms are getting smarter and they can now easily understand the content of a page. They are also able to understand a searcher’s intent, which makes it easier for them to match a query with a page and its content. Because Google is able to understand that information, it takes the initiative to rewrite the title tag, just because it can!
We saw and heard from different sources a few months ago that Google started displaying headline 1 in the SERPs instead of the meta title. But that’s not exactly true. In fact, back in October 2021, Mordy observed that 55% of the rewrites were coming from headline 1. However, that number has been going down to 48% since January 2022. Mordy shares that Google was never specifically interested in using the H1 instead of the meta title, Google just wanted to rewrite the title on its own to see how well it can understand the content of a page and make it match with a search query!
So yes, Google algorithms are getting smarter, to the point where they can rewrite or create content (=adapt meta title for now).
This is important because it’s the start of something new, the start of Google being able to write content to make it perfectly match the user’s intent. This is going to impact what is being shown on the SERPs and how it’s being shown, but it’s also impacting the control we think we have on our metadata.
2) How to write awesome SEO Reports?
In this talk, Greg Gifford shared tips and tricks to get awesome reports! He also highlighted some elements that should trigger you because they are, in most cases, signs of bad reporting methods!
Monitoring is not the same as reporting
The first point he shared is that monitoring is not the same as reporting! The dashboards you are using to monitor your results shouldn’t be used as a client report! The data we care about or that are important for us and our internal analysis is not necessarily relevant for our clients!
We often forget that clients can look at their own Google Analytics and Google Search Console. What we need to provide here are an interpretation of those data and our expert analysis.
It’s the same when it comes to the monthly reporting call which is usually following the delivery of that reporting where you might spend time just reading the numbers to your clients without giving them an explanation of the data evolution or any context!
Let’s take a step back and remember that our client is always coming to us with a problem. And they are counting on us to be the solution to that problem. This is what the reporting needs to reflect!
The best reports are not always the ones that are the most developed, contain a lot of data, and are the best good looking but rather the reports which are easy for the clients to read and understand.
Tracking the wrong data, overloading clients with too much information, and sharing pointless information (at least to them) are signs of non-efficient reporting.
Signs of bad reports
Stop including bad metrics in your reports!
To start, we need to know what data we want to show to clients! We all know that getting access to a lot of metrics is not the hard part. The hard part is to avoid sharing data that the client doesn’t need! We need to share data that matters for the client’s success. Sharing numbers because we have them or screenshots from Google Analytics without any explanation is a no-go!
Greg also shared a list of bad metrics that we should remove from our SEO reports:
1) Bounce rate: let’s say you’re spending a few minutes on a page, you’re finding a lot of interesting info, watching a video but nothing is tracked as an event. So you’ve shown interest but because nothing is tracked, Google reports a bounce. You might see a high bounce rate as a positive point! It might mean that people landed on the right page, directly found the info they were looking for, called you to convert or get even more info so they left quickly, is it negative? No. In fact, it’s so bad, it’s bouncing out of Google Analytics 4!
2) Time on site: same as bounce rate, having a low time on site might be positive for you! Indeed, it might mean that again, people landed on your page, directly found the right info because your SEO is on point, and then left.
3) Pages per visit: same story! You might want to see a low number here because again, that shows that people found the good info quickly. Let’s say you have 15 pages per visit, meaning that a person had to go over 15 pages before finding the info they were looking for, is that a positive thing? Sure no!
Stop including screenshots
Don’t add screenshots of Google Analytics or Search Console. Your clients can access their accounts themselves and find those data. It’s even worse if you don’t add contextual information.
Stop building reports that don’t tell a story
Your report should include context and comments. If it just includes data on top of data that the client doesn’t understand or that is not linked to the client’s end goal, it’s not a good report.
Stop showing only numbers
If you are used to always showing numbers in a square, without explanation, with a name the client will likely not understand, without a timeline, without MoM or YoY comparison, that’s another sign of bad reporting.
Always choose a timeline over a displayed number. A timeline is more visual and gives an overview of a trend.
In the end, what clients are expecting is to understand how we are going to provide them with a solution to their problems so that they can reach their goals.
Show that your SEO efforts are providing results that will help them reach their goals.
Tricks to provide good reports
Use a tear sheet
According to Greg, the most pertinent data to show the clients comes down to 4 different metrics:
- total traffic
- organic traffic
- total leads
- organic leads
Of course, some clients will want to have access to extra resources or will want a more in-depth analysis. However, he suggests displaying the most important metrics on the first page so it’s quickly accessible for stakeholders who don’t need more. Then the rest can be displayed after for people who need more data.
Customize report for your client
Not all clients are the same. They are coming from different industries, address different audiences, have different problems, and are pursuing different goals. Therefore, the reporting should always be adapted for every client.
Don’t use digital jargon but use questions instead
Adapting the report and its content to your client and their knowledge level of digital is key. If you are addressing a stakeholder who has basic knowledge about digital, avoid the digital jargon we all use internally. The client might not understand it! Instead of using “sessions” or “users”, why not turn it into questions that speak more to your client. For example: “how many people visited your site?” or “how is your organic traffic evolving over time?”.
Always try to put yourself in the mindset of your client, that’s the advice Greg is giving. It’s also a primordial point for us at Clicktrust!
Automate your reports & save time
Don’t waste time monthly on a task that can be automated. Google Data Studio is an awesome free tool that can help you build efficient reports.
Giving context
List the action you have taken and show to your client how it’s impacting your results! Explain to them the reason for those actions, what is the end goal you are pursuing and how it is linked to their objectives. Finally, don’t forget to share your next steps with them. They need to know that you will keep putting effort into the project and most importantly what your future plans are to reach their goals!
The endpoint is that reporting needs to tell a story!
Reports that tell a story = happy clients 😊
3) How to do an ASO Audit?
If your business or your client is using an application, this part will be very interesting for you! In this talk, Luis explained to us how to do an efficient ASO (aka App Store Optimization) audit!
Let’s go over Luis’ ASO Checklist:
1) Audience Analysis
Might sound like a valid point, but you need to be able to understand your audience. Ask yourself the right questions: Who is your app designed for? Who is actually using it? What do they expect from the app? This will help you design your app and adapt its features.
2) Analyse app features
Download the app yourself and investigate it. What are the main features? What does the app enable you to do? How does the user feel when using the app? Do they have the possibility to engage, to feel smarter, to get entertained, do they feel secure? You need to be able to understand what the main outcomes of your app are.
3) ASO Creatives
Can your app catch the user’s attention?
The creatives you use in the app are very important because it’s the first thing the user will see in the app store! They need to catch the user’s attention quickly.
Icons
The icon of the app is the first element the user will see in the app store. In his analysis, Luis observed that 3 main app icon designs are coming back more often:
- contrast: your logo is put forward and pretty visible against the background of the icon
- associations: add a logo or an element that refers to the product or service of your app
- naming: simply display your business name in the icon
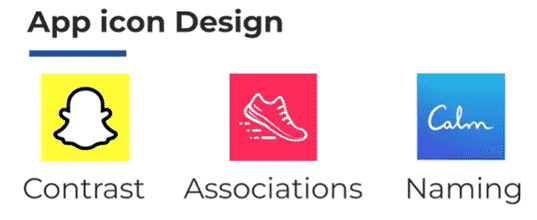
Another piece of advice Luis shared with us is to analyze what your competitors are doing and see if your app fits within the category. In his example, Luis was looking at applications all linked to the travel sector and observed that all apps’ icons are giving the user a feeling of movement and direction.
Screenshots
These images are also very important. Once the user has clicked on the app icon and opened it, the screenshots are the next visuals they will see.
If the icon did not do the job already, the first screenshot needs to directly indicate to the users what the app is about. To do that, there is nothing better than an image (usually an overview of the app) and a short but clear headline, just like in the example below.

The second screenshot needs to show the consumer benefits. What will this app bring them? Why should they use it?
The other screenshots can be used to show the user how the app works. For that, you can use a few images, including an overview of the app and the process or the main steps inside of the app. They need to include a quick overview of the app layout but also give the impression that the app is pretty simple to use!
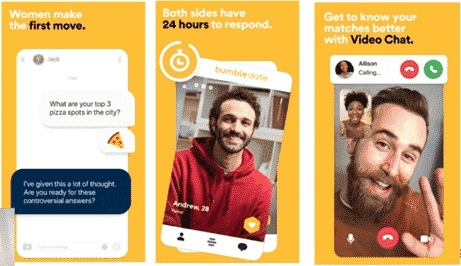
Lastly, you can use screenshots to show your audience why your app is unique and what the USPs are. Why should they use yours instead of a competitor? How is your app different from the other ones they can find in the app store?
Feature Graphic
Feature Graphic is another opportunity to display an image and show the user what the app is about and deliver a message. It needs to be aligned to your brand and the screenshots you shared, we need to find a common theme.
Preview video
The preview video is the element that has the biggest impact on conversions. According to Luis, it can increase your app downloads by 20% to 30%. In the preview video, you will usually use all the elements you put in your screenshots but in a video format. This is catchier for the user and gives another perspective of how the app is built.
It’s again an opportunity to show users what your app is about, what the benefit of the app is, and how it works but with a video format. The video usually lasts around 15 seconds. It’s short so the first 5 seconds are very important, it needs to deliver the main message to the users. By default, in the app store, the video is played on mute, so it needs to be able to do the job with but also without the sound! This is why it’s important to add headlines or call out to give context and explanations to the visual.
4) Meta Data
Title & Subtitle
This is the most important metadata and should include your focus keyword. This is the keyword you want your app to rank for and which drives conversions. A very important element you need to consider is the length, which shouldn’t go over 30 characters. In the example below, they used less than 30 characters, so they have more room to add important keywords.
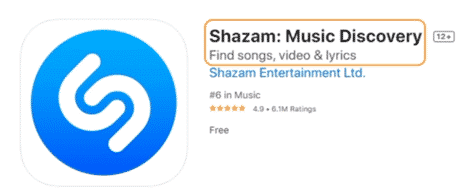
Short description
The short description should include a clear call to action and explain again what your app is about. In the Shazam example they used: Give an answer to: “what’s that song?”, the maximum length is 80 characters for the short description so we can conclude that Shazam is again missing an opportunity to share an extra message here and to display important keywords.
Long description
In the long description, the density of keywords can be increased. It’s the element where you can include your primary keywords, but also secondary keywords or synonyms. Try to share your main message in the first lines of the description. Indeed in Google Play, the users will only see the first lines, the rest of the description is accessible only after they click on “Read more”.
5) Reviews
Reviews and ratings are the elements that are affecting app conversion rates the most! Moreover, a high level of ratings and a high tendency to answer reviews will affect ranking algorithms.
Useful resources for development
The best resource to understand what is working well in your app or what is not is to read your users’ reviews! They are using it from a different perspective. Therefore, users are in the best position to give objective feedback about your app!
Reply to reviews
You need to make sure that developers are answering the users’ reviews. Answering the positive comments is an opportunity to thank your users for using your app. You can also engage with them on other channels and suggest them to give an even better review!
But even more importantly, answer the negative reviews as well! Show the users that their feedback matters and that you are taking action by sharing it with your developer team. Or even better, answer to let them know that a new feature is live or that a bug has been resolved! Good to know: the user will have the opportunity to review their rating after you replied to them!
Get our ramblings right in your inbox
We deepdive into hot topics across digital marketing and love to share.