
Many companies are confronted with huge amounts of data and the challenge to get the most value out of it for their marketing mix.
In this blog post, we will discuss how data segmentation has a key role in how to convert more prospects and ultimately sell more.
As Avinash Kaushik wrote a few years back: The Choice is Stark: Segment or Die!
And to this day, this statement remains valid!
Big data can be quite overwhelming and you can easily find yourself lost. Looking at unstructured aggregated data from different sources may lead to analysis paralysis and prevent you from extracting truly actionable information. The most important thing is to start taking small steps by segmenting, to get closer to valuable insights about your customers. The process of segmentation is a process that can be done regardless of the size of your business.
What is data segmentation? Why is data segmentation important?
Data segmentation is the process of gathering the data a business has and dividing it into smaller segments to help you understand the customers’ behaviour.
For example, here are some questions you may be asking yourself:
1) Which region do the majority of my search campaign prospects come from?
2) Do we see a difference in conversion behaviour between men and women?
3) Is there a preferred device my prospects use?
With data segmentation, you will be able to make informed decisions on what can be done to grow your business.
Types of segments in Google Analytics
In Google Analytics you can find predefined segments such as paid traffic, all users, Direct traffic, Returning users, Converters, Mobile traffic, etc.
These segments can be found by clicking on the plus sign to add a segment and then by choosing to view the system segments as shown below:
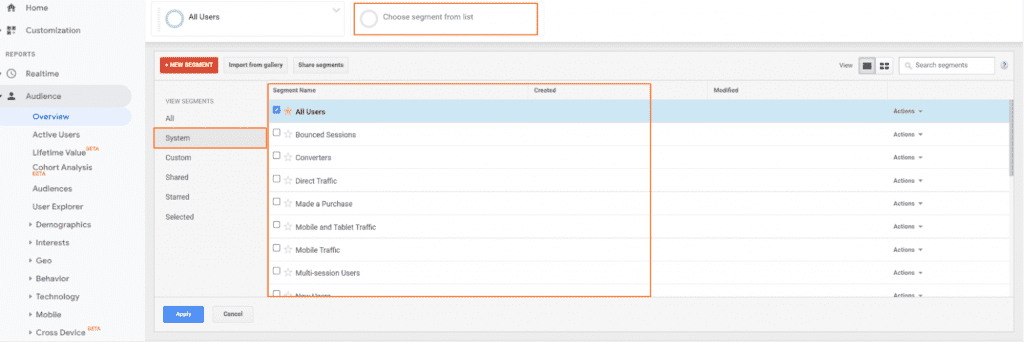
These default segments can help you dive into a particular group’s data. It’s best to check these segments before you start creating your own, just to make sure the one you need isn’t already accessible.
Then you have custom segments. These are the interesting ones, to use when going deeper into segmentation. The segments are based on rules you can define. You could, for instance, create a segment about users who have interacted for the 1st time with your paid activities from Facebook.
Creating custom segments in Google Analytics (UA)
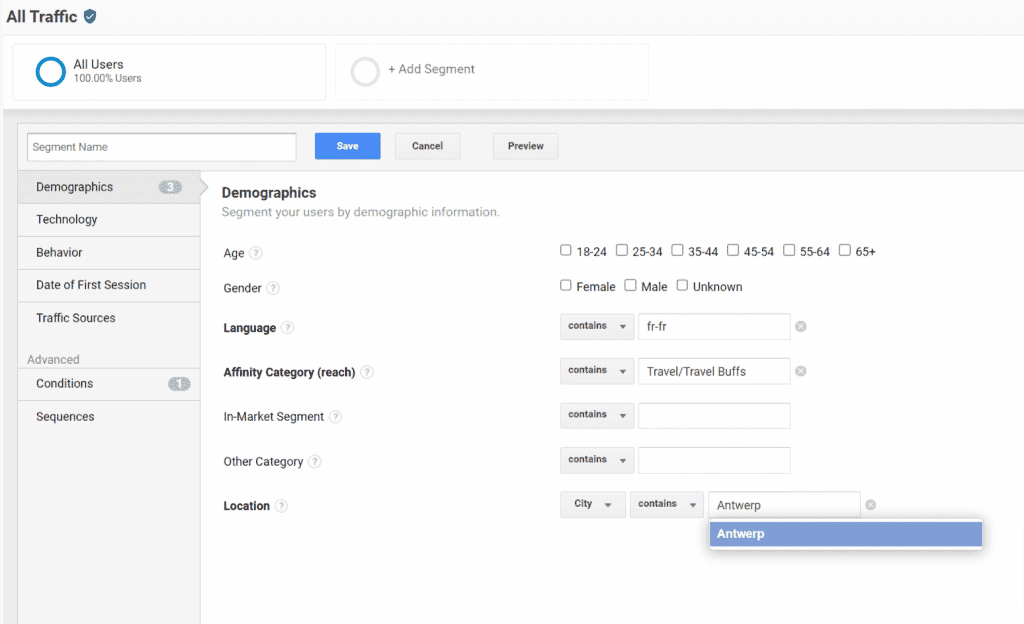
In order to create segments in Google Analytics (Universal Analytics), you will need to access the “Add a segment“ at the top and choose “Custom”. There you will be able to create your segment, based on predefined dimensions such as Demographics, Technology etc.
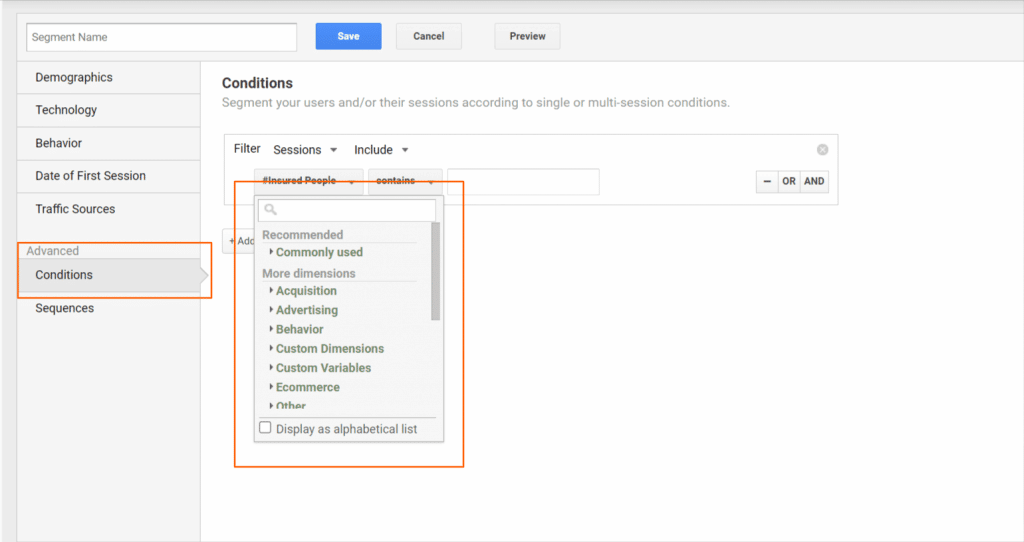
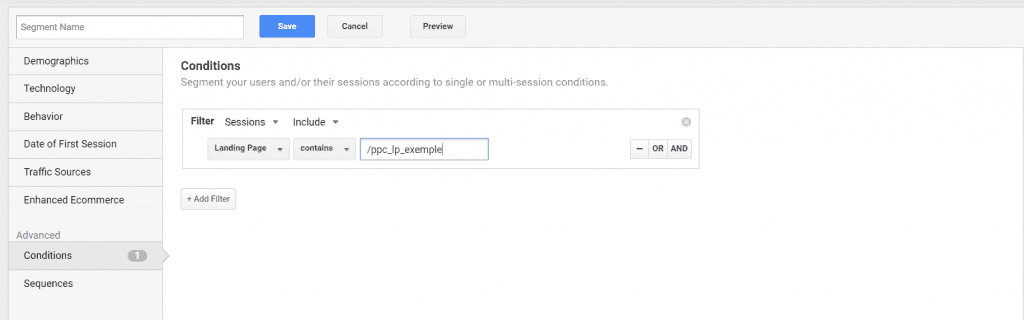
If none of the dimensions suits your needs you can go ahead and create a segment based on conditions.
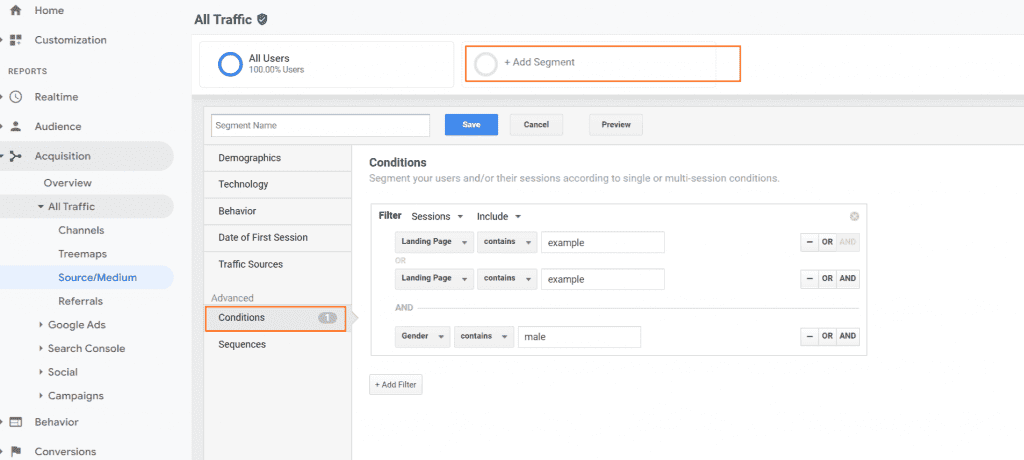
Within the advanced section, ”Conditions” lets you choose any dimensions and metrics you need to build your segment.
Applying segmentation to your data in Google Analytics (UA)
Let’s say you have an e-commerce website and you want to use Segmentation to understand your customer, improve your campaign and therefore have a better conversion rate.
These are some ways you could start segmenting and analysing your data to understand your customers.
Google Analytics location and language report segmentation
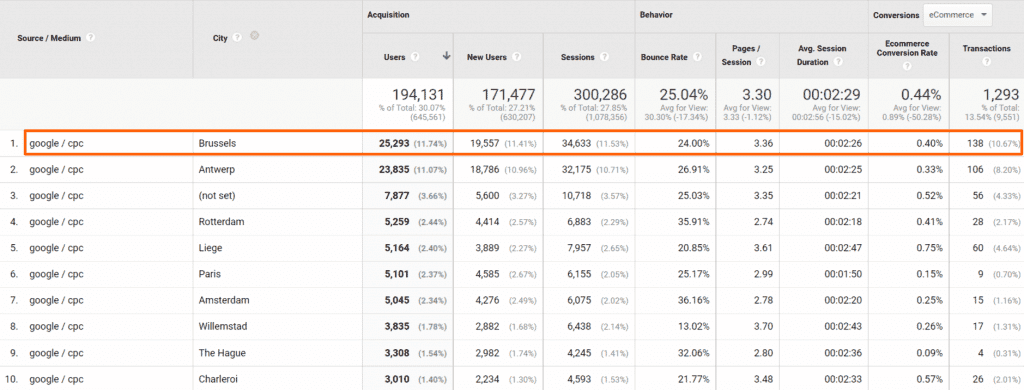
If for instance, you would like to know which city drives the most traffic for your paid campaigns, you can do the following in Google Analytics:
1) Create a custom segment with the traffic sources google / CPC for example
2) Then apply the segment to your data
3) And lastly, choose the location report under Audience
4) And then move to the language tab
In the example below, we can see for instance that Brussels is the main driver of traffic and transactions for the paid campaigns.
However, we can see that little traffic comes from NL speakers and they barely convert.
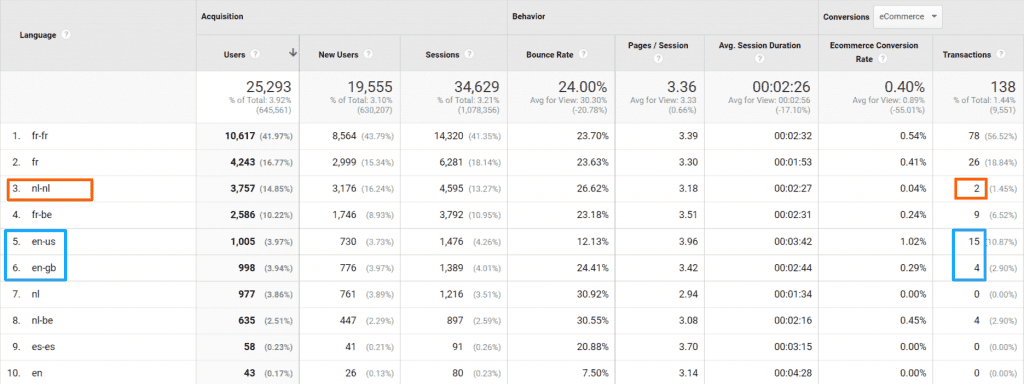
We can ask ourselves if our PPC campaigns are set up correctly in terms of the language split. Is there anything that can be done in terms of copies, targeting, and landing pages?
We also see an opportunity for English speakers, do we have a dedicated landing page or message for them?
Google Analytics mobile overview report
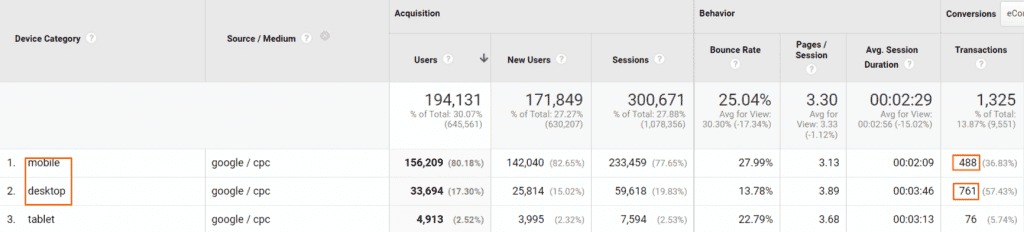
Another way to segment your data could be by looking at the device split.
1) Once you’ve created your custom segment, apply it to the report
2) Select the mobile overview report under the audience tab
In our example below the majority of PPC users arrive via mobile but more than half of the transactions are made on a desktop. Why is that? Is the website not mobile-friendly? Is this due to the nature of the business?
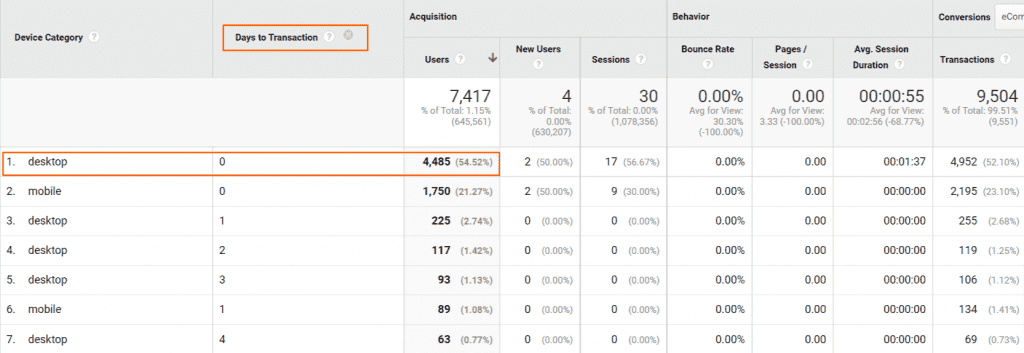
This is further reinforced by the fact that the majority of desktop visitors make a purchase the first day they visit the website, while that’s not the case for mobile users. This could indicate that the mobile version is not well-suited for transactions.
Google Analytics demographics segmentation
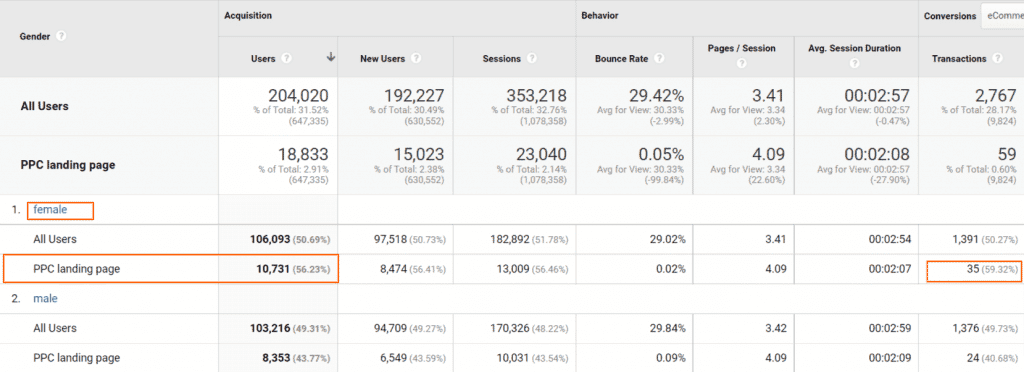
You may also want to know if more men or women arrive at a certain landing page and how they convert.
1) Create a custom segment where you specify the landing page to analyse
2) Apply the segment to the gender demographics report under the audience tab
In our example, women have a higher conversion rate on that particular product. This information could be used for the type of messaging, and visuals used in the campaign. We could for instance decide to have a higher percentage of the budget spent on Women.
Google Analytics behaviour flow segmentation
Data segmentation can also be used to understand at what stage of your funnel there is a drop-off and see what actions could be taken to reduce that.
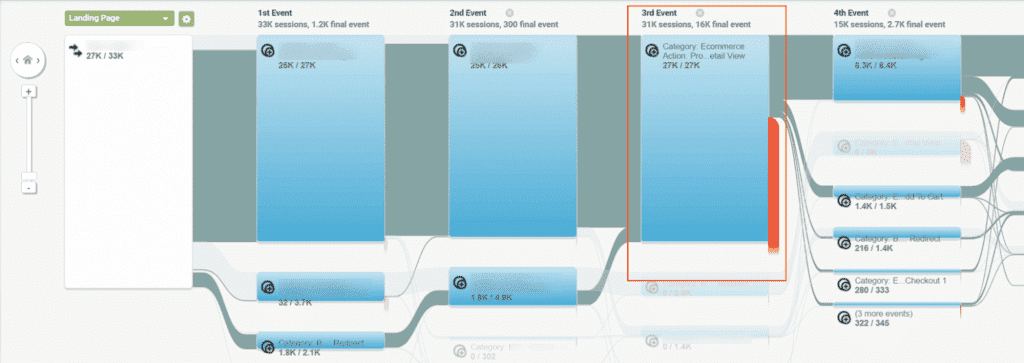
The behaviour flow report under the behaviour tab can provide you with insights for a specific page or a specific segment that you’ve defined.
1) Create your custom segment (i.e. all google / CPC traffic)
2) Apply the segment to the behaviour report
In our example, we see a big drop-off at the 3rd stage of the funnel. This could for instance mean we would need to do some CRO and AB tests where the drop-off occurs. Or retarget those users with a specific message.
Excluding segments in Google Analytics
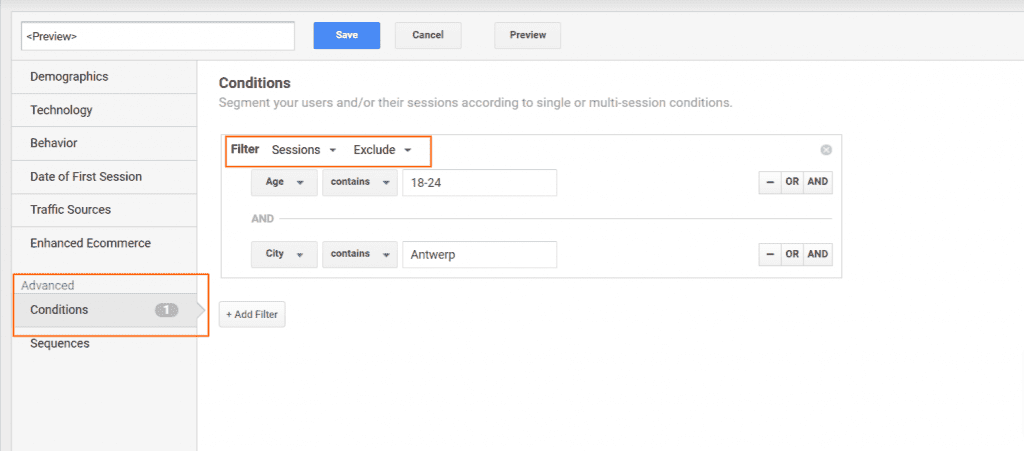
In the examples above, we mainly discussed including segments that we wanted to analyse. However, there may be situations where we need to exclude a particular segment from our analysis. This could be for instance excluding people under a certain age if we are not catering to them, or people from a specific location etc. To do so, you need to create your custom segment and exclude the sessions as shown below:
What about Google Analytics segments in GA4?
In Google Analytics 4 you can create and apply segments only when you’re using the exploration reports. So this means you will need to create an exploration report and a segment.
This is completely different from Google Analytics (Universal Analytics) where segments could be applied to default and custom reports.
How to Create Google Analytics Segments in GA4?
1) In GA4 navigate to “Explore” in the main menu on the left
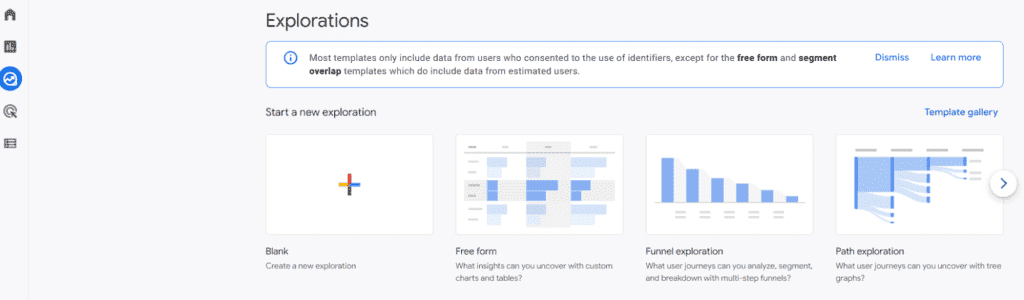
2) Create an exploration report or use an existing report and name that report
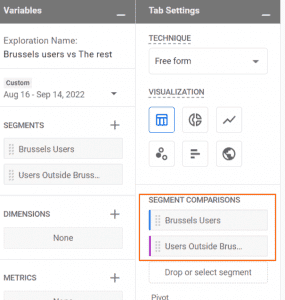
3) On the left, there is an option to add segments, dimensions and metrics to use in your report
4) When clicking on segments you can see the type of custom segments that can be created (for example User, Event or Session segment)
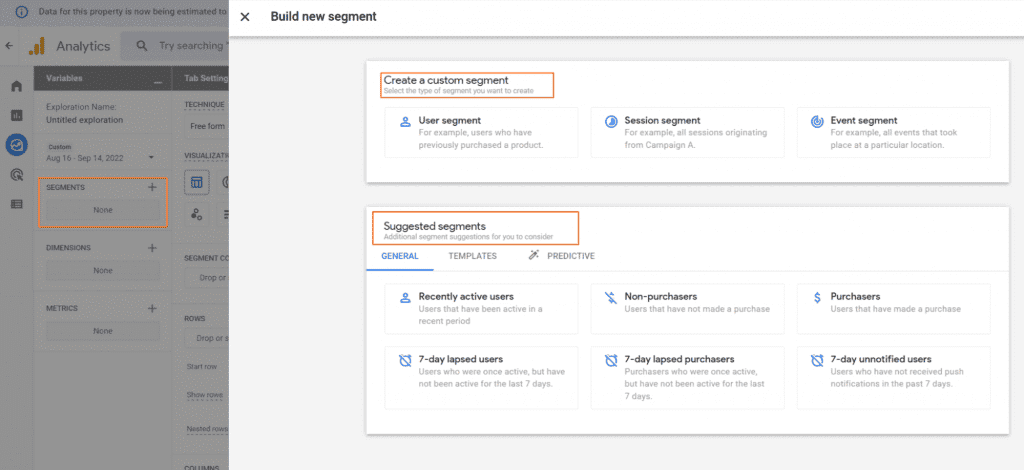
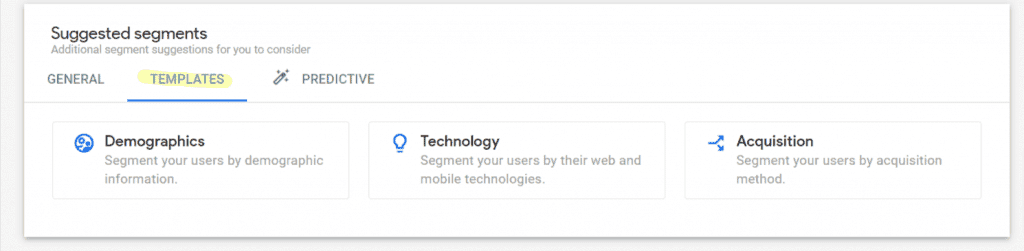
5) Below the custom segments, we can see the “suggested segments that Google automatically suggests for your account. You can find for example under the template tab the demographics segment
6) Then you have the predictive tab, where you have predictive segments that become available if the account meets Google’s minimum requirements. Because these audiences rely on a minimum of data to ensure they are accurate.
7) Then create a segment by clicking on the plus sign. And enter the conditions you would like. For example, all users from “Brussels”. Then save and apply.
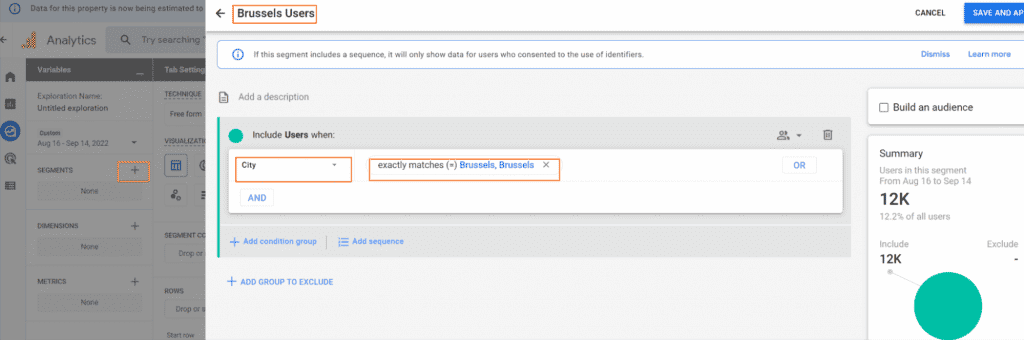
8) After that, create another segment for all users outside of Brussels, for example.
9) You now have added your segments to your report
10) Now you need to add your dimensions and metrics and drag the dimension under rows and the metrics under values
11) In our example, you can now see a comparison of the device category sessions from people in Brussels and Outside of Brussels
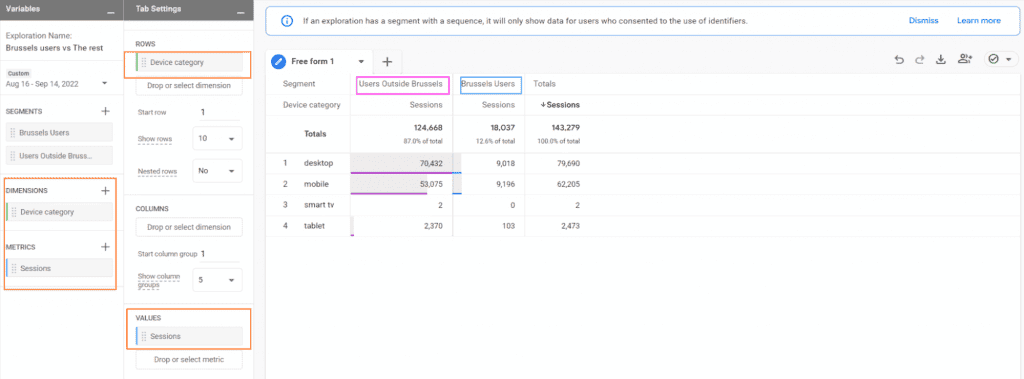
12) You can now save your report or add other segments or dimensions you would like to analyse.
The main point about GA4 is that segments can only be applied to exploration reports. And what’s great is that you can apply up to 4 segments in 1 report to see how they perform and compare them.
These were a few examples of what data segmentation can look like both In Google Analytics (UA) and GA4 and what insights and questions it could help you answer.
Ultimately, although the amount of data collected by digital tools is still quite big, segmentation can be an easy tool to use in order to improve conversion and make your business more profitable in the long run.
Get our ramblings right in your inbox
We deepdive into hot topics across digital marketing and love to share.