A step-by-step guide to finding new and untapped audiences using the Facebook API.
The majority of competing advertisers in your niche target the same audiences as you do. That’s a fact. Everyone is competing in the same auctions causing high CPMs and audience fatigue. But what if you could target “hidden” audiences that no one is targeting yet?

Let’s deep dive into it.
What are hidden interests?
Let’s say your “ideal client” is interested in Golf. You then want to target Golf & related interests. You create a new campaign, set up your ad set then have to choose interests to target.
By default, Facebook retrieves 15 to 20 interest or additional interest.
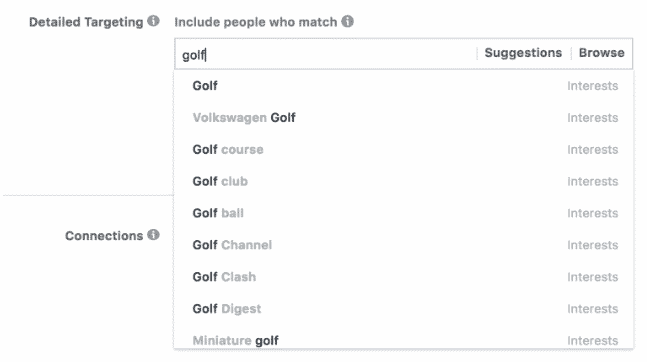
However, it pulls out the same results for every advertiser! Then you spend hours manually looking for additional interests…
There are of course more related interests than the 15 to 20 interests Facebook shows you in the interface. What if you could access the entire interests and additional interests list?
That’s where the Facebook API enters into play.
Let’s have a look at our “Golf” interests retrieved from the API:
https://graph.facebook.com/search?type=adinterest&q=[Golf]&limit=10000&locale=fr_BE&access_token=API-token
Enter this URL in your browser and you’ll see something similar to the screenshot below (replace API-token by your own token. We’re explaining how to get it further down in the article).
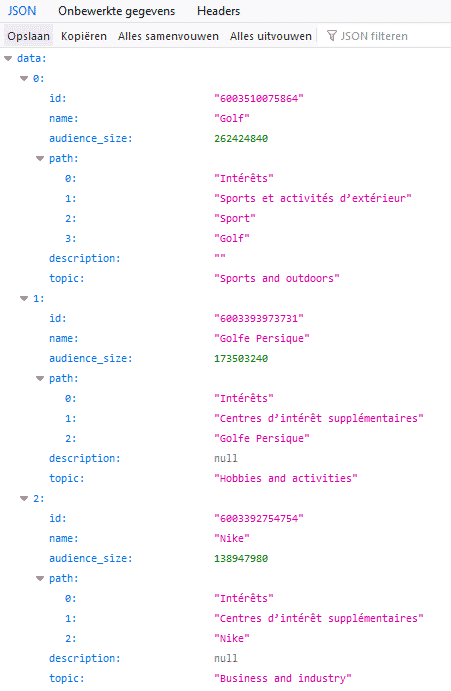
You can see a huge list of interests related to your main theme. But let’s face it, it’s not very reader-friendly or easy to use. In this article, we’ll explain how to easily get these results into a more user-friendly Excel file.
By using this method, we can for example find the “European PGA Tour” and “Tiger Woods” interests that Facebook initially didn’t suggest and we didn’t think of. From here, you could add other Golf stars as targeting such as “Rory McIlroy” and other PGA tours.
Side note: The API doesn’t return an output for each and every interest. In some cases, no additional suggestions will be returned. Additionally, the API results, for some reason, don’t always contain all of the suggestions made in the interface.
As a result, we suggest using both the interface suggestions and the results from API calls (if any) to find the ideal interest targeting for your campaigns.
How to retrieve related interests and make the results reader-friendly?
The result of the API call that shows you all of the suggested or related targeting options are unfortunately not very readable. Let’s change that in 2 simple steps :
- Create an API token to access the Facebook API.
- Create a Rstudio project to export the results straight in an Excel sheet ready to use.
1) Create a Facebook API key.
You need to create a developer account
It’s totally free and takes 1 minute to setup.
Once your account is created, you have to create what Facebook calls an “app” in your developer account. This will create the access token that you need to access the API to retrieve your “hidden interests”.
Once your app is created, you can find your access token over here: https://developers.facebook.com/tools/accesstoken/
This should look like this (use the User Token):

2) Making an RStudio project
To be able to pull out the data into an easily readable excel sheet, we’ll use a script CLICKTRUST is providing to you today.
We will use the R language and R Studio, both of which you’ll need to install on your computer:
- Download the R language
- Download RStudio
But no worries, you don’t need any developer skills to do so, we have already created everything for you!
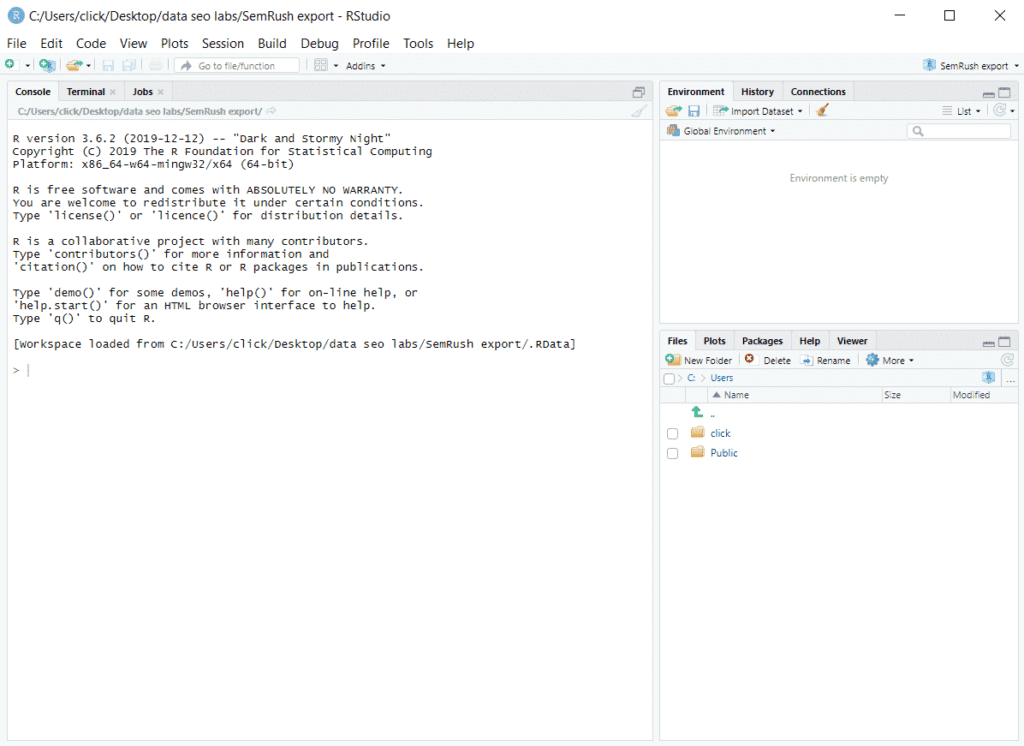
Once installed, open RStudio. You should see something similar to this.
Next, go to File > New Project and create your new project in an existing folder (= Directory) or create a new folder for this project.
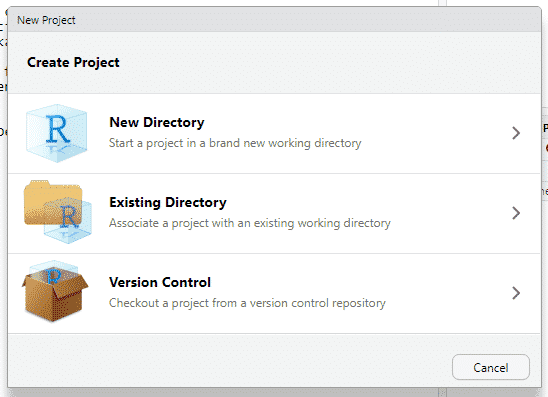
The folder you create your project in will be the “working directory”. This is also the folder in which we’ll store the excel files that contain the API outputs.
Once your project is created, go to File > New File > R Script. The left hand side of the RStudio interface should now display two zones:
- The place where you can enter code. (top side)
You can recognize this by the numbers in the sidebar indicating the lines of code. These will make it easy to search and find specific lines of code you’ll have to edit later. - The console. (bottom side)
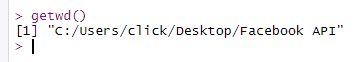
This zone was already visible before you created the R script file. In the console, you can also enter lines of code, however, you can only run one line at a time (in the script zone, you can run multiple lines in sequence). For example, try entering “getwd()” in the console (without the “…”). The console will return the working directory (= the folder where you created the project)
3) Installing packages
First, you need to install packages in R-Studio.
Packages are collections of R functions, data, and compiled code in a well-defined format. The directory where packages are stored is called the library. R comes with a standard set of packages. Others are available for download and installation. Once installed, they have to be loaded into the session to be used.
From https://www.statmethods.net/interface/packages.html
As you can read above, packages are used to build onto the default functionalities of the R language and will be used in most scripts.
To install a package, enter the following command in the console:
install.packages(“packagename”)
To load a package enter the following command in the console:
library(packagename)
However, as each time you’ll run the script you’ll need to load the packages, it’s better to enter these commands into the script file (see full script later). As packages are installed on your computer, there’s no need to install them every time you run the script.
Instead of installing all packages separately, enter the following command into the console to install all necessary packages with one line of code:
install.packages(c(“jsonlite”, “readxl”, “writexl”, “urltools”))
4) Installing the script
Once this process is completed, you can paste the script code in the script zone of Rstudio. With a few modifications, you can get all of the suggested interests from the hard-to-read JSON format into a readable, sortable and filterable Excel file.
We will not be going over each individual part of the code, only the parts that need modification.
You can find the script code below:
library(jsonlite)
library(readxl)
library(writexl)
library(urltools)token <- “EAAsXdpZApFWyvW1tm8jXOnqsV1JSf”
limit <- 10000# locale is listed as ll_CC
# ll being langauge (lower case)
# CC being country (upper case)
locale <- “fr_BE”
adinterest <- url_encode(“Golf”)interestsUrl <- paste(“https://graph.facebook.com/search?type=adinterest&q=[“,adinterest,”]”,
“&limit=”,limit,
“&locale=”,locale,
“&access_token=”,token,
sep=””)print(interestsUrl)
interests <- fromJSON(interestsUrl)
interests <- as.data.frame(interests)relatedInterestsUrl <- paste(“https://graph.facebook.com/search?type=adinterestsuggestion&interest_list=[%22″,adinterest,”%22]”,
“&limit=”,limit,
“&locale=”,locale,
“&access_token=”,token,
sep=””)Relinterests <- fromJSON(relatedInterestsUrl)
Relinterests <- as.data.frame(Relinterests)pathname <- paste(adinterest,” – “,locale,”.xlsx”, sep =””)
require(openxlsx)list_of_datasets <- list(“Interests” = interests, “Related Interests” = Relinterests)
write.xlsx(list_of_datasets, file = pathname)
5) Adjusting the code
To quickly find the lines of code that need editing, look for the numbers in the left-hand sidebar.
On line 6, enter your API token. It’ll be much longer than the one shown in the example below.
On line 7, enter the maximum amount of results you want to extract. In general, you can leave this at 10000.
![]()
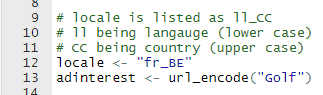
On line 12, enter the locale for which you want to find related interests. The example above will return interests for Belgium in Dutch. (fr_fr, en_us,..)
On line 13, enter the interest category for which you want to find more targeting ideas.
That’s it! That’s all of the code-editing that’s needed.
The rest of the code will make calls to the API URLs shown above and put the results in an excel format in your working directory. The file names will include the interest and locale for easy reference.
6) Run the script
But let’s save the script first! Press the save button marked in the screenshot below, give the script file a name and save it in the working directory.
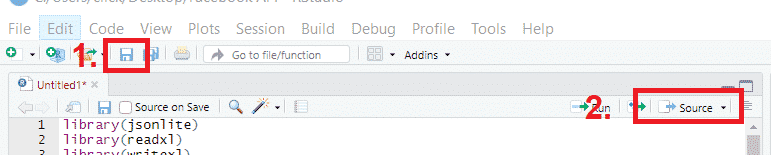
Next, press the source button and the entire script will run, get the API results and save an excel file in the working directory.
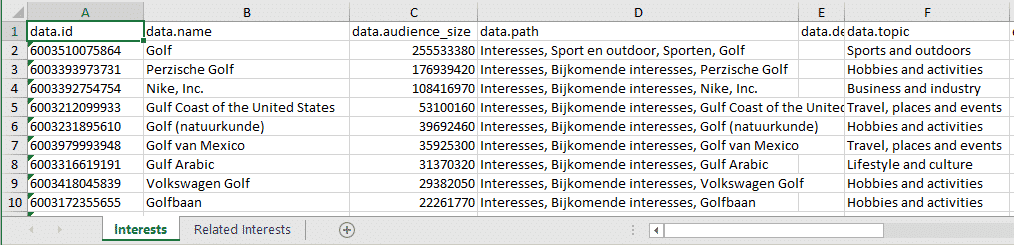
There you go! All interests and their audience size directly in an excel sheet ready to use.
You only have to edit line 12 and/or 13 if you want to run it for another interest category and press “Source” again.
Ontvang onze inzichten rechtstreeks in je inbox
We duiken regelmatig in actuele onderwerpen op het gebied van digitale marketing en delen onze inzichten graag met jou.